Comparing Panasonic A, Panasonic B, Sanyo, and Ultrafire cells March 11 2016, 8 Comments

Cells deconstructed from the top, Panasonic A, Panasonic B, Sanyo FM showing various lengths of electrolyte foils.
This blog article will explore the differences between a sampling of Panasonic, Sanyo, and Ultrafire 18650 batteries.
To do so I will exclusively refer to a paper published here in 2015.
Background
Lithium-ion was first made available in 1991. Since then it has become more apparent that it is the best solution for energy storage. However one problem with lithium-ion and the 18650 battery is the difficulty in getting reliable, honest ratings.
It’s hard to know whether the specifications are true because:
- Possible rating inflation from manufacturers
- Person rating is not educated on how to accurately test cells
- Difficulty obtaining authentic cells and proper equipment
Overview: Important physical characteristics
Cells tested

The cells tested from left to right are:
- UltraFire TR18650 4200 mAh
- UltraFire TR18650 4900 mAh
- Sanyo UR18650FM
- Panasonic NCR18650A
- Panasonic NCR18650B
The most important physical characteristics that distinguish the 18650 are:
- size
- weight
- shape
The 18650 (18mm by 65mm) has evolved as the best trade-off between capacity and charge/discharge ability in terms of these characteristics.
Other 18650 battery characteristics
There are many conditions that will alter the performance of your cells.
- Max and min voltage
- Capacity of cell at beginning of life
- Capacity at different charge / discharge rates
- Capacity at different temperatures
The max and min voltage can be reduced from the extremes.
For example instead of charging a battery to 4.2 V and discharging to 2.5 V, one might only use a range between 3.2 V and 3.8 V. This can lead to an increased cell cycle life.
The capacity at the beginning will be greater than any proceeding time because of natural cell degradation.
An increase in charge or discharge amperage will decrease the working capacity and life cycle of a cell.
Furthermore, any deviation from the testing temperature of 25 degrees Celcius the cells will result in reduced performance. This is especially true under 0 degrees and above 60.
Other testing variables that should be accounted for when accurately testing cells:
- cell chemistry
- capacity
- formats
- charging, discharge profiles
- temperature
- test set-up
Initial results
| P 3100 | P 3400 | S 2600 | UF 4200 | UF 4900 | |
| Typ. Charge Capacity (mAh) | 3070 | 3350 | 2600 | 4200 | 4900 |
| Min. Charge Capacity (mAh) | 2950 | 3250 | 2500 | - | - |
| Meas. Charge Capacityb (mAh) | 2862 (2961) | 3166 (3267) | 2480 | 757.1 | 579.4 |
| – (% of typical) | 93.2 (96.4) | 94.5 (97.5) | 95.4 | 18 | 11.8 |
| Meas. Energy Capacity (Wh) | 10.19 (10.61) | 11.33 (11.78) | 9.25 | 2.74 | 1.96 |
| Nominal Weight (g) | ≤47.5 | ≤48.5 | ≤48 | - | - |
| Measured Weight (g) | 44.66 | 46.7 | 45.62 | 32.24 | 37.98 |
| Nominal Length (mm) | ≤65.3 | ≤65.3 | 64.9±0.2 | - | - |
| Measured Lengthd (mm) | 65.08 | 67.34 | 64.96 | 65.74 | 65.44 |
| Nominal Diameter (mm) | ≤18.5 | ≤18.5 | 18.3±0.2 | - | - |
| Measured Diametere (mm) | 18.28 | 18.57 | 18.28 | 18.27 | 18.22 |
| Specific Energy (Wh/kg) | 228.3 (237.6) | 242.6 (252.3) | 202.8 | 84.8 | 51.6 |
| Energy Density (Wh/l) | 596.9 (621.3) | 621.3 (646.2) | 542.6 | 158.7 | 114.8 |
| Cost per Cell (AU$) | 11.48 | 13.48 | 5.31 | 1.45 | 1.63 |
| Cost/Meas. Capacity ($/kWh) | 1125.9 (1081.8) | 1189.7 (1144.0) | 574.1 | 530.1 | 831.7 |
| Cost/Meas. SE ($kg/kWh) | 50.29 | 55.56 | 26.19 | 17.09 | 31.59 |
How the test works
Step 1: Charge and discharge
Charge to 4.2 V at 1A and then taper charge to 50 mAh and terminate.
Then,
Discharge at 1A
- First 5 cycles discharged to 2.8 V
- For discharge 6 and 8, the Panasonic cells were discharged to 2.5V (because these cells offer a lower cut-off voltage, allowing the researchers more comparability)
Stage 2: Weight and dimensions
Taking measurement of weights especially enable comparisons of 18650 battery energy density. Weight is a critical constraint in electric vehicles especially as it reduces the km driven per charge.
Stage 3: Impedance
Checking the impedance - cells tested at a frequency range of .1 Hz and 100 kHz.
Step 4: Aging and life cycle of cells.
Testing to conclude after 100 cycles, or by the end of the month whichever happened first - how much the capacity has faded and impedance has changed.
Step 5: Rest and test
Let the cells rest for anywhere between a couple days to a few weeks. And then take a final capacity test in the same conditions as the very first test. That will show how much the cell degraded between first and last test.
Initial testing:
Dimensions
All 18650 cells are actually slightly larger than 18mm by 65mm. The paper found the diameter is 3.2% and the length is 3.6% larger than the 18650 standard. It’s important for those who want to create large battery packs with thousands of cells.
Interestingly, it also skews the “lithium-ion energy density measurements” that everyone uses as the size is a critical component of the formula and seldom is it accounted for.
Capacity
| Battery | mAh | Cycle | Av. Capacity Reduction per 100 Wh Throughout (%) |
| Panasonic | 3100 | partial | 0.43 |
| Panasonic | 3100 | full | 0.7 |
| Panasonic | 3400 | partial | 0.57 |
| Panasonic | 3400 | full | 1.51 |
| Sanyo | 2600 | partial | 0.75 |
| Sanyo | 2600 | full | 0.66 |
| Ultrafire | UF4200 | partial | 3.71 |
| Ultrafire | UF4200 | full | 2.24 |
| Ultrafire | UF4900 | partial | 16.6 |
| Ultrafire | UF4900 | full | 67.9 |
Panasonic cells achieved over 93% of their advertised rated charge capacity. The Panasonic cells did not reach their full capacity because they did not use the proper cut-off voltage (2.5V) and they used a “fast” charge current of 1A where they might use .5A or lower. Furthermore optimizing the temperature would have likely allowed them to reach their full potential.
Ultrafire cells were between 12% and 18% worse. There is no surprise here.
Full Cycle Life

There is clear downwards aging trend after 50 - 130 cycles
Partial Cycle Depth of discharge study

Charge and discharge from 3.2 to 4.0 V, to decrease the depth of discharge. This should offer an increase in the cycle life of the cells.
Note, the Depth of discharge, or (DOD) differs from the state of charge (SoC) by being an alternate way of measuring charge, albeit somewhat reversely. When one goes up, the other goes down.
The comparison between cells fully cycled and cells partially cycled is interesting because it can help you decide between two options:
- To buy expensive high capacity cells and do partial discharge
- Or buy cheap low capacity cells and do full discharge
If we look at the chart we can see that the Panasonic cells to degrade slower when having a decreased voltage range. Unfortunately, the Ultrafire cells do something not expected for 18650 batteries - they degrade much faster.
Unfortunately, this makes the data (because of the cells) unreliable - calling for more cells to be tested for conclusive comparisons.
However if you just focus on the Panasonic and Sanyo cells you can see by limiting the depth of discharge there is some improvement in the life cycle.
Impedance Study
Panasonic Cells
- The main difference was charge transfer capacitance - it decreased by two orders of magnitude
- At the same time, the electrode diffusion capacitance increased by two orders of magnitude.
What is charge transfer?
Now most readers have no idea what charge transfer capacitance is, but if you are curious you want to know. It begins with something called the charge transfer coefficient.
In lithium-ion cells, charge transfer is defined as the fraction of over-potential that affects current density.
Overpotential is a measure that directly translates to voltage efficiency (using more or less energy than thermodynamics require). Inefficiencies are seen as a loss of usable energy in the form of heat.
Sanyo Cells
The same thing happened to these cells (charge transfer capacitance decrease, diffusion increase).
The difference between the Sanyo and the Panasonic cells are an increase in ohmic resistance (how much is the cell opposing the flow of current). This is due to the battery chemistry type, notably the electrolyte formulation which is outdated.
Ultrafire Cells
The same trend continues here.
The big difference is the Ultrafire cells had a much higher increase in ohmic resistance. This could have been predicted - these cells are terrible.
Paper Conclusions
Initial capacity testing found the Panasonic and Sanyo cells performed within 8% of their rated capacity.
Panasonic and Sanyo cells:
- Capacity: Within 8% of rated capacity
- Life Cycle: 2-6% degradation after 50 - 80 cycles (700 Wh)
- Resistance: Low rise in ohmic resistance
Ultrafire:
- Capacity: Less than 20% of rated capacity (one cell died)
- Life Cycle: 6% (300 Wh) - 20% (30 Wh) degradation
- Resistance: High-rise in ohmic resistance
More on the Ultrafire cells
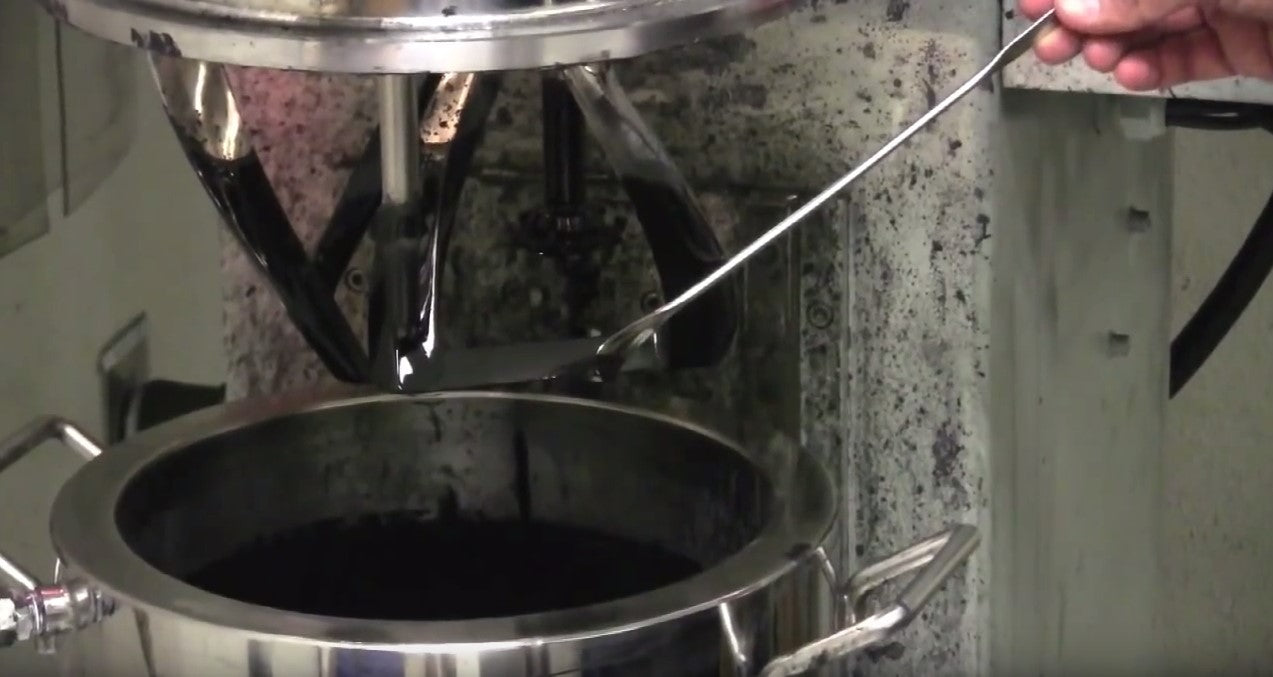
The authors of the paper found that actually inside many Ultrafire batteries are smaller batteries. It’s not Russian dolls, it’s cheap 18650 batteries!
Counterfeiters purchase blank 18650 steel tubes and then don’t fill them up all the way. It’s the classic potato chip bag bait-and-switch.


The electrolyte foils were found to only comprise 73% to 74% of the space the Panasonic or Sanyo cells did.

CT scan of Ultrafire batteries.

Last picture - the Ultrafire 4200 from this article cut in half.
Source:
Vyroubal, P., et al. "3D Modelling and Study of Electrochemical Characteristics and Thermal Stability of Commercial Accumulator by Simulation Methods." Int. J. Electrochem. Sci 11 (2016): 1938-1950.


Comments
jGecko on August 17 2020 at 11:42AM
In 2020 my test results are stunningly consistent with yours on tested capacity vs. spec’d capacity when it comes to cell brands/counterfeits/etc.
I used 3 different test instruments and the results were also consistent between the different test methodologies used by the instruments as well. In addition, known high quality, non-counterfeit cells closely met, 91% to 100%, of their spec’d capacities whereas as “fire” cells and a few other brands consistently achieved below 70% of spec’d capackty. One test group of newly purchased “new” cells was labeled to lead one to believe it was a Panasonic 3,000mAh cells, yet all six them performed at about 800mAh. The test used “kinder” liberal test parameters (like low load) that would produce higher mAh results than would most tests.
Testers used:
1) SkyRC iMAX B6ACv2 Balance Charger/Discharger
2) 150W/180W Constant Current Electronic Load 200V 20A Battery Capacity Tester
3) ZB2L3 18650 Lithium Lead-acid Battery Capacity Meter Discharge Analyzer
Test voltages measured were also checked with Hantek DSO5202P with chan1=test cell, compared to chan2=internal reference and external temp compensated reference voltage IC.
Tim on September 20 2019 at 02:16AM
Hello
I’ve got several bright torches with crazy fire batteries. Eg 4200m Ah
They are looking ( leaky?)
Certainly not working right .
Is there a range I can get in uk which would be as good and easier to get
Thanks
isaac gonzalez on July 05 2019 at 03:00AM
excellent research, keep the good work!
Don A on September 07 2018 at 08:25AM
How long I have looked for a report like this. I wish I had read this 5 years ago when I started collecting 18650 flashlights and was stupid enough to purchase from eBay some of the inferior brands you exposed here. I know, I know, if it sounds too good to be true …. but the bargain hunter in us is hard to stifle.
Just around the time you published this I was coming to the same conclusion but after many cheap batteries tossed down the recycle bin. Good on ya as they say down under and I am certain you made many people both angry and happy with this article. All I can say to the readers out there is to trust this guy – you probably knew something was up when one battery goes for $2 and the other $7. My advise is to buy the premium battery folks because the bargain will only be in the trash in a couple of months.
Thanks again!
Mark Atherton on April 07 2018 at 06:34PM
from http://www.ultrafire.com/ultrafire-18650-battery-review-a183
“we dont produce any 18650 battery that the capacity is 4000mAh, 5000mAh or above”
Sounds like both of your UF cells were counterfeit …
Yang on April 12 2016 at 05:35AM
Thanks for one of the most thorough articles about different battery qualities I have ever read. Solid information and very nice photos.
Thank you, many +++++
Yang / Sweden
Anton on March 15 2016 at 05:17AM
That is an excellent point Kyle,
Please keep in mind the data collected was not by Battery Bro, this article is a break-down of a scientific publication in the journal of The Electrochemistry Society.
The cell in question is the Panasonic B which measures at 67.34mm in length on this paper. I just went and measured a Panasonic B I have here with PCB and button top. It measured about 72mm.
So the Panasonic B might have only had the button-top, and not the circuitry measured. Also, looking at the image provided the Panasonic does not appear to be standing much higher in terms of its negative terminal where the PCB would be attached. Either way, it’s definitely worth mentioning. Thank you.
Kyle Repinski on March 14 2016 at 08:38PM
Your measurements on the height, width, as well as other characteristics, of the Panasonic NCR18650B cell is inaccurate. The top of the cell you pictured is button-top, and appears to have an extra clear wrapper over the original green one. It is likely that a protection circuit has been added to this cell, they don’t come with these. This explains the large height discrepancy you listed, and may have caused other measurements to be inaccurate as well.
Your very own shop listing for the NCR18650B cell shows it without the button-top.